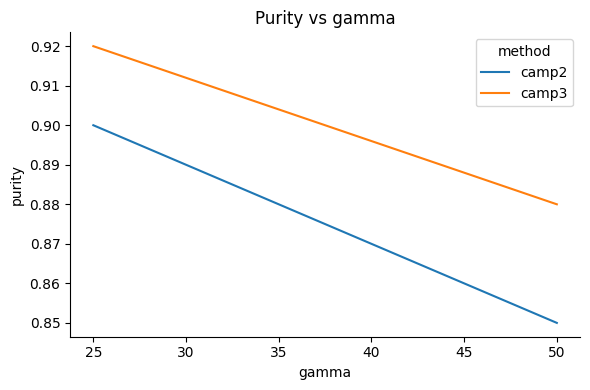
campmc.pl.metric_lines#
- campmc.pl.metric_lines(df, out_png=None, *, x_col, y_col, hue_col=None, title='Metric', show=False)[source]#
Save or display a line plot of a metric from a tidy DataFrame.
- Parameters:
- df
DataFrame Tidy table of metric values.
- out_png
str|Path|None(default:None) If set, write the figure to this path (PNG).
- x_col
str Column for the x-axis.
- y_col
str Column for the y-axis.
- hue_col
str|None(default:None) Optional grouping column (separate lines).
- title
str(default:'Metric') Plot title.
- show
bool(default:False) If
True, display viaplt.show()and returnNone.
- df
- Return type:
Figure|None- Returns:
The figure when
showis false andout_pngis not set; otherwiseNoneafter saving or displaying.
Examples
import pandas as pd
import campmc as cp
df = pd.DataFrame(
    {"gamma": [25, 50, 25, 50], "method": ["camp2", "camp2", "camp3", "camp3"], "purity": [0.9, 0.85, 0.92, 0.88]}
)
cp.pl.metric_lines(
    df,
    x_col="gamma",
    y_col="purity",
    hue_col="method",
    title="Purity vs gamma",
    show=True,
)