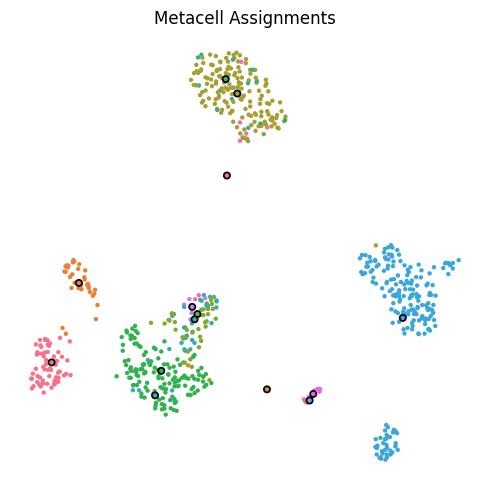
campmc.pl.assignment#
- campmc.pl.assignment(adata, *, embedding_key='X_umap', partition_key='camp', colour_metacells=True, title='Metacell Assignments', figsize=(5.0, 5.0), metacell_size=20.0, cell_size=10.0, show=False)[source]#
Plot a 2D embedding coloured by CAMP metacell assignments.
- Parameters:
- adata
AnnData AnnData with partition labels in
obsand a 2D embedding inobsm.- embedding_key
str(default:'X_umap') obsmkey for the 2D plot (e.g.X_umaporX_pca).- partition_key
str(default:'camp') Column in
adata.obswith metacell labels.- colour_metacells
bool(default:True) If
True, colour cells by metacell and overlay group-mean centroids. IfFalse, grey cells with red centroid markers.- title
str(default:'Metacell Assignments') Figure title.
- figsize
tuple[float,float] (default:(5.0, 5.0)) Figure size in inches.
- metacell_size
float(default:20.0) Marker size for metacell centroids.
- cell_size
float(default:10.0) Marker size for single cells.
- show
bool(default:False) If
True, display viaplt.show()and returnNone.
- adata
- Return type:
Figure|None- Returns:
The figure when
showis false; otherwiseNoneafter displaying.
Examples
import campmc as cp
import scanpy as sc
adata = sc.datasets.pbmc68k_reduced()
cp.partition(adata, method="camp3", gamma=50, random_state=0)
cp.pl.assignment(adata, embedding_key="X_umap", show=True)