campmc.pl.sizes#
- campmc.pl.sizes(adata, *, partition_key='camp', bins=None, title='Distribution of Metacell Sizes', figsize=(5.0, 5.0), show=False)[source]#
Plot the distribution of cells per metacell.
- Parameters:
- adata
AnnData AnnData with partition labels in
obs.- partition_key
str(default:'camp') Column in
adata.obswith metacell labels.- bins
int|None(default:None) Number of histogram bins;
Noneuses seaborn defaults.- title
str(default:'Distribution of Metacell Sizes') Figure title.
- figsize
tuple[float,float] (default:(5.0, 5.0)) Figure size in inches.
- show
bool(default:False) If
True, display viaplt.show()and returnNonefor the figure.
- adata
- Return type:
- Returns:
Tuple of
(figure, sizes)where sizes is from {func}`campmc.mt.metacell_sizes`. figure isNonewhenshowdisplays the plot.
Examples
import campmc as cp
import scanpy as sc
adata = sc.datasets.pbmc68k_reduced()
cp.partition(adata, method="camp3", gamma=50, random_state=0)
cp.pl.sizes(adata, show=True)
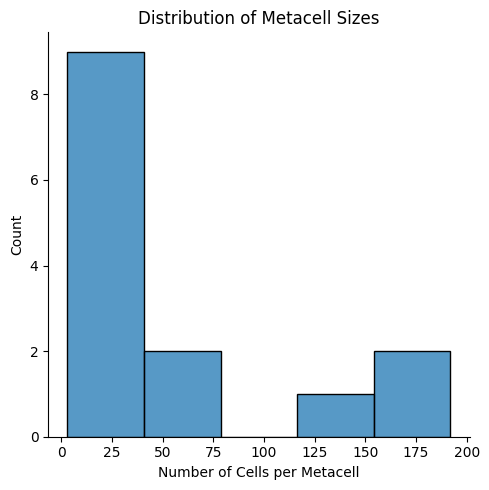
(None,
                    size
 camp
 seed0-50-__all__     65
 seed1-50-__all__     34
 seed10-50-__all__     3
 seed11-50-__all__   158
 seed12-50-__all__    42
 seed13-50-__all__   140
 seed2-50-__all__     10
 seed3-50-__all__     30
 seed4-50-__all__      4
 seed5-50-__all__    192
 seed6-50-__all__      3
 seed7-50-__all__      5
 seed8-50-__all__      8
 seed9-50-__all__      6)