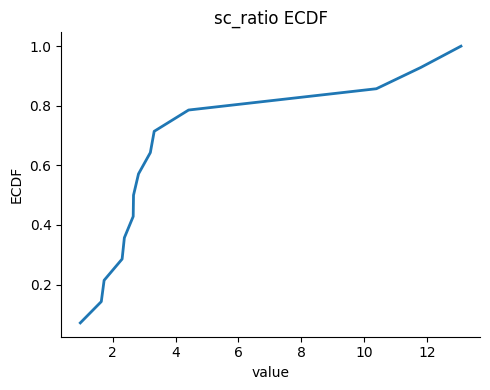
campmc.pl.metric_ecdf#
- campmc.pl.metric_ecdf(values, out_png=None, *, title='Metric ECDF', show=False)[source]#
Save or display an empirical CDF plot for a 1-D metric array.
- Parameters:
- Return type:
Figure|None- Returns:
The figure when
showis false andout_pngis not set; otherwiseNoneafter saving or displaying.
Examples
import campmc as cp
import scanpy as sc
adata = sc.datasets.pbmc68k_reduced()
cp.partition(adata, method="camp3", gamma=50, random_state=0)
qc = cp.mt.quality(adata, partition_key="camp")
cp.pl.metric_ecdf(qc["sc_ratio"].to_numpy(), title="sc_ratio ECDF", show=True)